
首先請看〈圖一〉所表示的是一個cosine函數,各位可以看出來,在一秒內,這個函數變換了3次,所以我們說這是一個頻率為3的cosine函數。請各位再看〈圖二〉,這個訊號既不是cosine,也不是sine,它究竟是什麼呢?如果我們用傅立葉轉換來分析這個訊號,你就可以得到〈圖三〉。〈圖三〉什麼意義呢?我們可以發現〈圖三〉是左右對稱的,而〈圖三〉所給的資訊只要看左邊的部份就可以。在左邊,我們可以看到兩個尖端,一個在頻率f=7的地方,一個在頻率f=15的地方,換句話說,〈圖二〉的這個訊號其實是兩個訊號的和:
大概說起來,傅立葉轉換的理論是說,任何一個訊號,都是一大堆cosine函數的和。為了避免太抽象的數字理論,我在這篇文章介紹的是離散傅立葉轉換(Discreate Fourier Transform)。傅立葉轉換是一種分析的工具,我們可以利用傅立葉轉換來看任何一個訊號內究竟有什麼樣的訊號:

〈圖四〉的訊號是一秒鐘的音樂訊號,對於我們來說,這當然是一頭霧水,不知道這個訊號葫蘆裡賣什麼藥,〈圖五〉是〈圖四〉訊號的離散傅立葉轉換頻譜。讀者可以看到真正重要的頻率集中在3000Hertz之前,我們幾乎可以說,3000Hertz以後的訊號是不太重要的。我也要強調離散傅立葉轉換有一個對稱性,各位讀者只需要看8192hertz以前的頻率就能夠了,大於8192Hertz的頻率一概是多餘的。
參考資料:傅立葉轉換(Fourier Transform)
以下是SineWave作者John Ehlers 2007年所發表的應用傅立葉轉換的交易策略:
策略程式碼
inputs:Price(MedianPrice), Window(50),{ maximum Window = 50 } OverBought(70),OverSold(30),Frac(0.5) ;inputs:ExitType(1), NBarL(2),NBarS(2),TradeProfit(0.05),TradeStopLoss(0.02);
inputs: ATRs_L(3),ATRs_S(3),BaseProfit(10000),VolatilityATRs(2), ATRLength(10);
variables: HP(0),CleanedData(0),Per(0),CosPer(0),CycPer(0),Alpha1(0),Period(0),n(0),
MaxPwr(0),Num(0),Denom(0),ThreeMinus(0),DominantCycle(0),Change(0),AbsChange(0),Count(0),DFT_RSI(0) ;
{ arrays are sized for a maximum period of 50 bars }arrays: CosinePart[50](0),SinePart[50](0),Pwr[50](0),DB[50](0),SF[50](0),NetChgAvg[50](0), TotchgAvg[50](0),RSIArray[50](0) ;
{ detrend data by high-pass filtering with a 40 period cut-off }vars: IsBalanceDay(False),MP(0),PF(0),PL(0);
if DAYofMonth(Date) > 14 and DAYofMonth(Date) < 22 and DAYofWeek(Date)= 3 then isBalanceDay = True else isBalanceDay =False ; PF = AvgPrice*TradeProfit ; PL = AvgPrice*TradeStopLoss ; if CurrentBar <= 5 then begin HP = Price ; CleanedData = Price ; end else if CurrentBar > 5 then begin
Per = 360 / 40 ;
CosPer = Cosine( Per ) ;
if CosPer <> 0 then Alpha1 = ( 1 - Sine( Per ) ) / CosPer ;
HP = 0.5 * ( 1 + Alpha1 ) * ( Price - Price[ 1 ] ) + Alpha1 * HP[1] ;
CleanedData=(HP+2*HP[1]+3* HP[2] + 3 * HP[3] + 2 * HP[4] + HP[5] ) / 12 ;
end ;
{ calculate DFT }for Period = 8 to 50 begin
CosinePart[Period] = 0 ;
SinePart[Period] = 0 ;
for n = 0 to Window - 1 begin
CycPer = ( 360 * n ) / Period ;
CosinePart[Period] = CosinePart[Period] + CleanedData[n] * Cosine( CycPer ) ;
SinePart[Period] = SinePart[Period] + CleanedData[n] * Sine( CycPer ) ;
end ;
Pwr[Period] = Square(CosinePart[Period]) + Square(SinePart[Period]) ;
end ;
{ find maximum power level for normalization }MaxPwr = Pwr[8] ;
for Period = 8 to 50 begin
if Pwr[Period] > MaxPwr then MaxPwr = Pwr[Period] ;
end ;
{ normalize power levels and convert to decibels }
for Period = 8 to 50 begin
if MaxPwr > 0 and Pwr[Period] > 0 then
DB[Period] = -10 * log( 0.01 /( 1 - 0.99 * Pwr[Period] / MaxPwr ))/log(10) ;
if DB[Period] > 20 then DB[Period] = 20 ;
end ;
{ find dominant cycle using CG algorithm }Num = 0 ;
Denom = 0 ;
for Period = 8 to 50 begin
if DB[Period] < 3 then begin ThreeMinus = 3 - DB[Period] ; Num = Num + Period * ThreeMinus ; Denom = Denom + ThreeMinus ; end ; end ; if Denom <> 0 then DominantCycle = Num / Denom ;
Change = Price - Price[1] ;
AbsChange = AbsValue( Change ) ;
for Count = 1 to Window begin
if CurrentBar = 1 then begin
SF[Count] = 1 / Count ;
NetChgAvg[Count] = ( Price - Price[Count] ) / Count ;
TotChgAvg[Count] = Average( AbsChange, Count ) ;
end else begin
NetChgAvg[Count] = NetChgAvg[Count][1] + SF[Count] * ( Change - NetChgAvg[Count][1] ) ;
TotChgAvg[Count] = TotChgAvg[Count][1] + SF[Count] * ( AbsChange - TotChgAvg[Count][1] ) ;
if TotChgAvg[Count] <> 0 then
RSIArray[Count] = ( 50 *( NetChgAvg[Count] / TotChgAvg[Count] + 1 ) )
else
RSIArray[Count] = 50 ;
end ;
end ;
DFT_RSI = RSIArray[ iff( Frac * DominantCycle < 50, Frac * DominantCycle, 50 ) ] ; { CB > 1 check used to avoid spurious cross confirmation at CB = 1 }
if Currentbar > 1 then begin
if DFT_RSI crosses over OverSold then Buy ( "RSI-LE" ) next bar at market ;
if DFT_RSI crosses under OverBought then Sell( "RSI-SE" ) next bar at market ;
end ;
if ExitType = 1 then SetStopLoss(PL * BigPointValue) ;
if ExitType = 2 then Begin
SetStopLoss(PL * BigPointValue) ;
setProfitTarget(PF * BigPointValue) ;
end;
if ExitType = 3 then Begin
if MP > 0 and BarsSinceEntry = NBarL then ExitLong next bar at Market ;
if MP < 0 and BarsSinceEntry = NBarS then ExitShort next bar at Market ; end; if ExitType = 4 then Begin SetStopLoss(PL * BigPointValue) ; setProfitTarget(PF * BigPointValue) ; if MP > 0 and BarsSinceEntry = NBarL then Sell {ExitLong} next bar at Market ;
if MP < 0 and BarsSinceEntry = NBarS then Buy {ExitShort} next bar at Market ; end; if ExitType = 5 then Begin Variables: PosHigh(0), ATRVal_L(0); ATRVal_L = AvgTrueRange(10) * ATRs_L; If BarsSinceEntry = 0 Then PosHigh = High; If MarketPosition = 1 Then Begin If High > PosHigh Then
PosHigh = High;
ExitLong ("ATR") Next Bar at PosHigh - ATRVal_L Stop;
End
else
ExitLong ("ATR eb") Next bar at High - ATRVal_L Stop;
Variables: PosLow(0), ATRVal_S(0);
ATRVal_S = AvgTrueRange(10) * ATRs_S;
If BarsSinceEntry = 0 Then
PosLow = Low;
If MarketPosition = -1 Then Begin
If Low < PosLow Then
PosLow = Low;
ExitShort ("ATR_1") Next Bar at PosLow + ATRVal_S Stop;
End
else
ExitShort ("ATR_1 eb") Next bar at Low + ATRVal_S Stop;
end;
if isBalanceDay then SetExitonClose ;
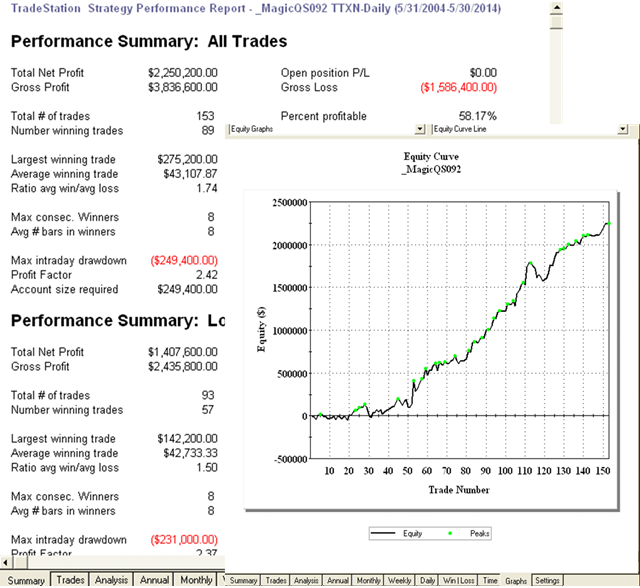
台指期 日K 留倉 2004/5/31 ~ 2014/5/30 交易成本 1200


從年/月績效來看是一個穩定的波段策略喔 !


0 意見:
張貼留言